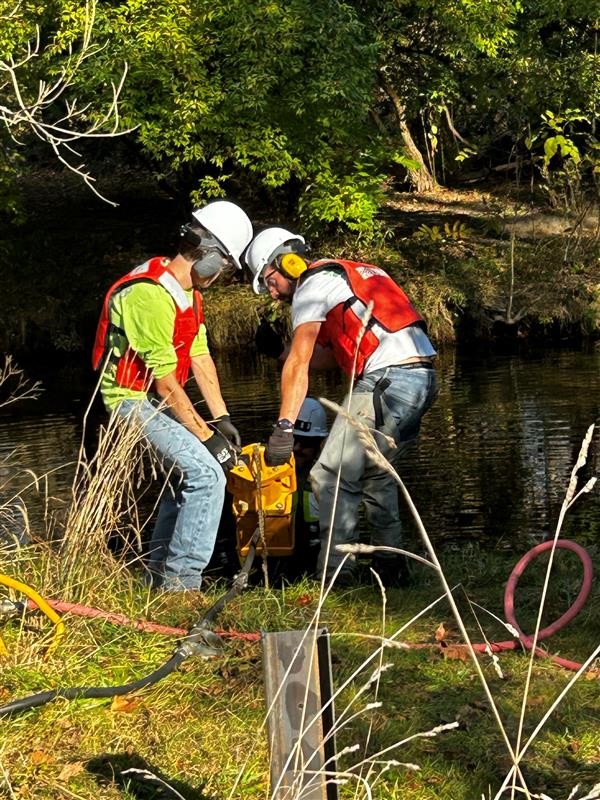
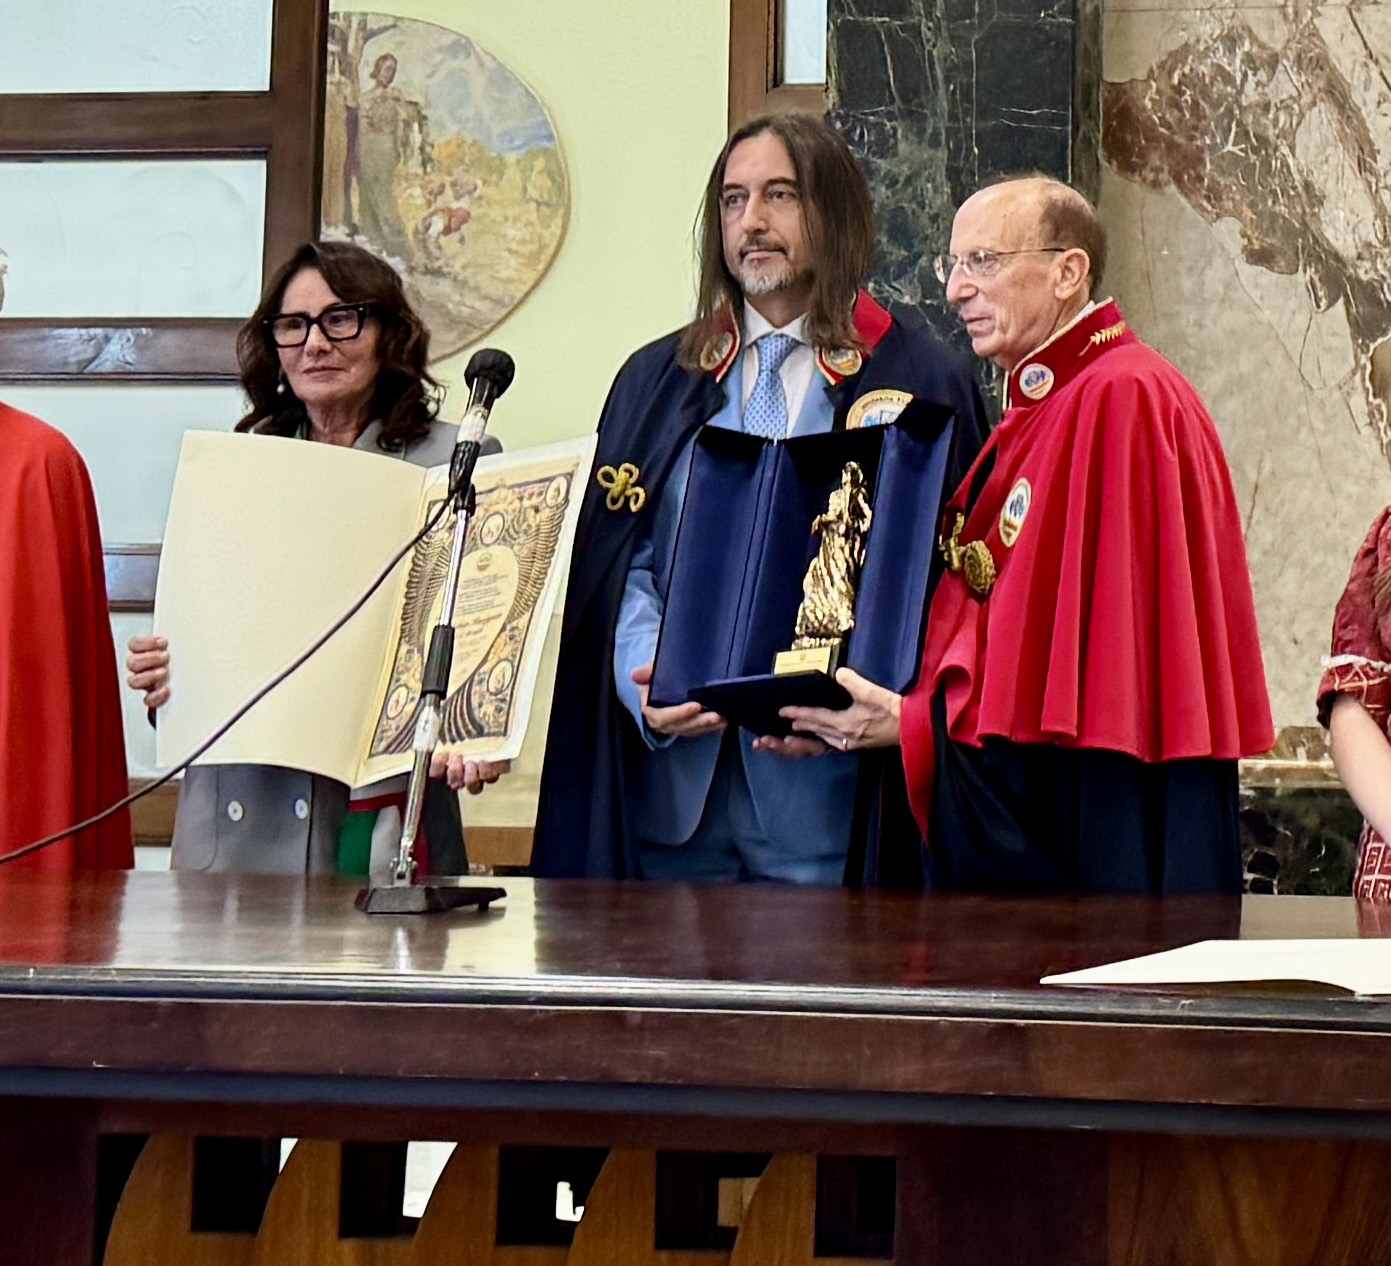
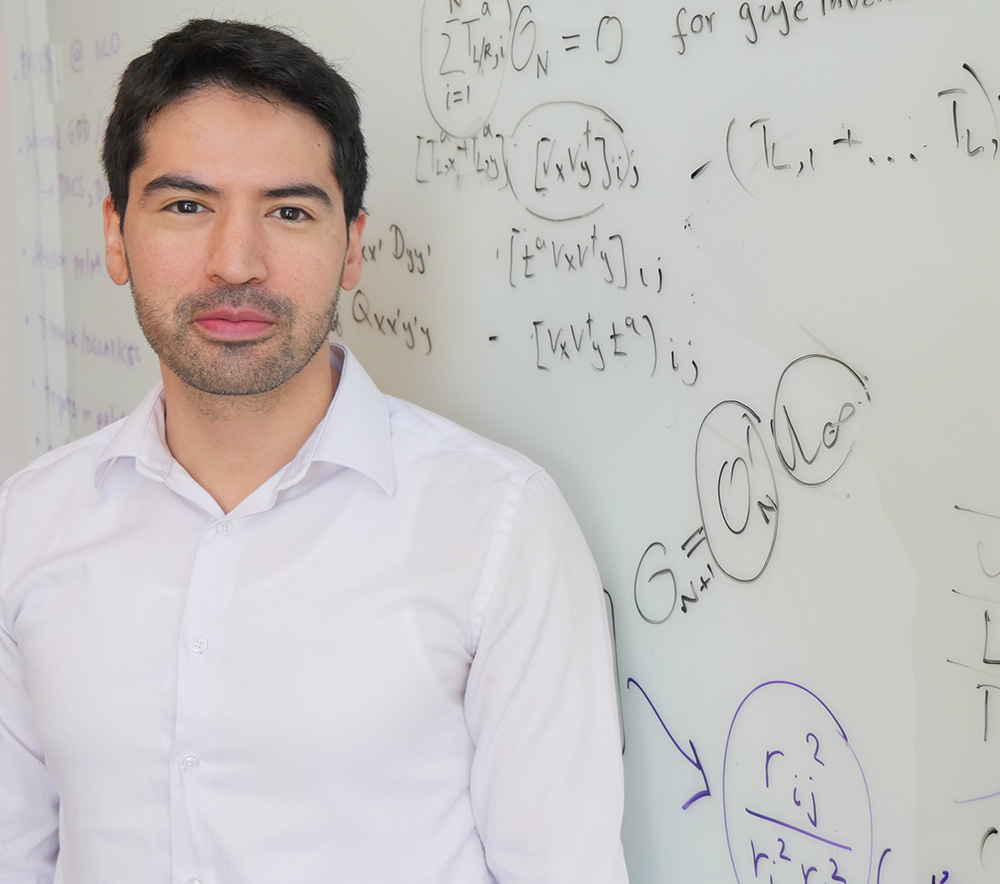
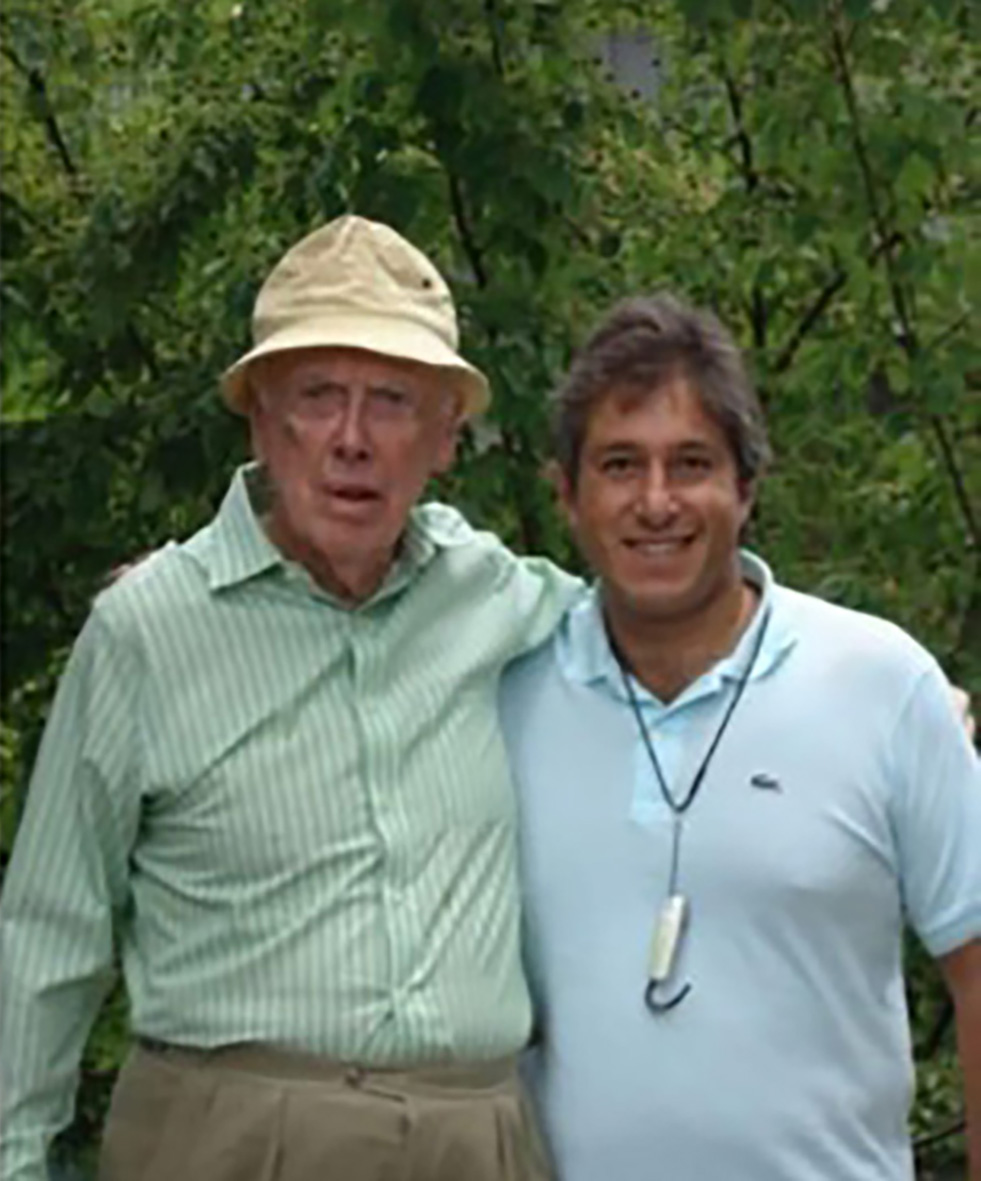
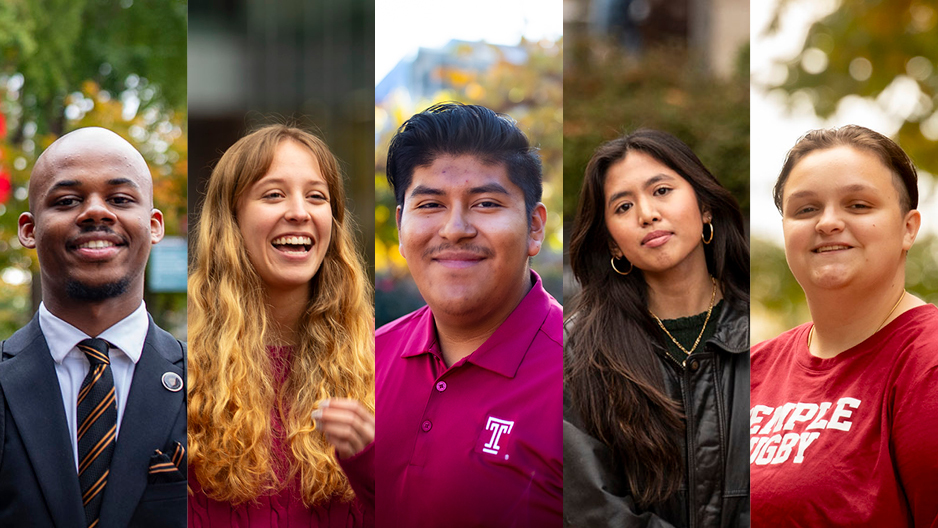
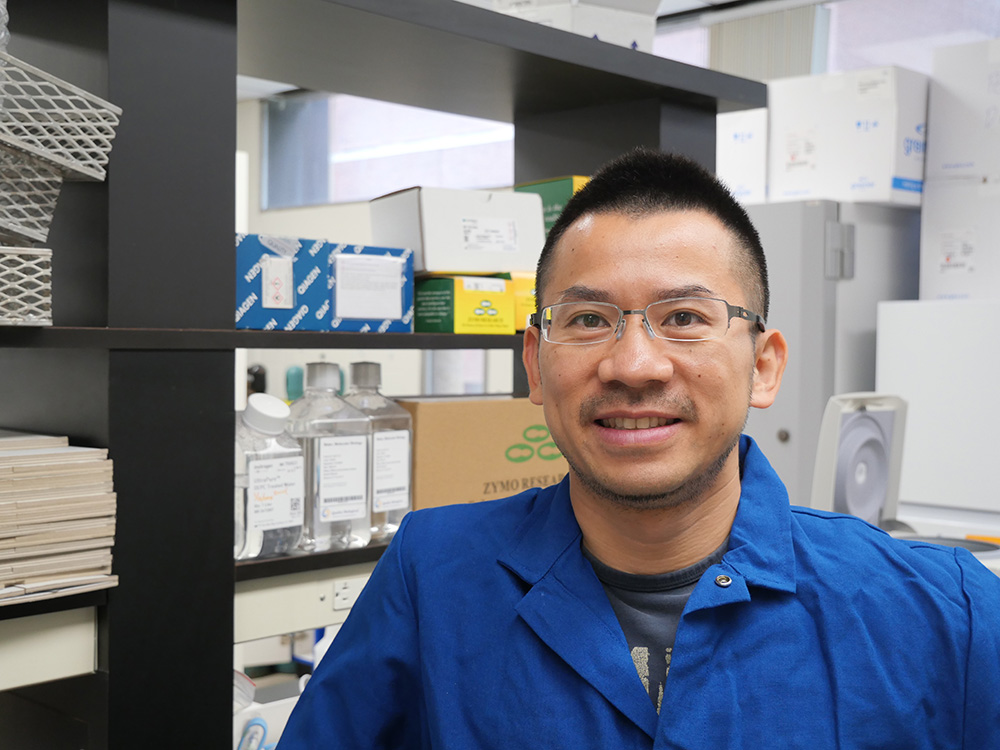
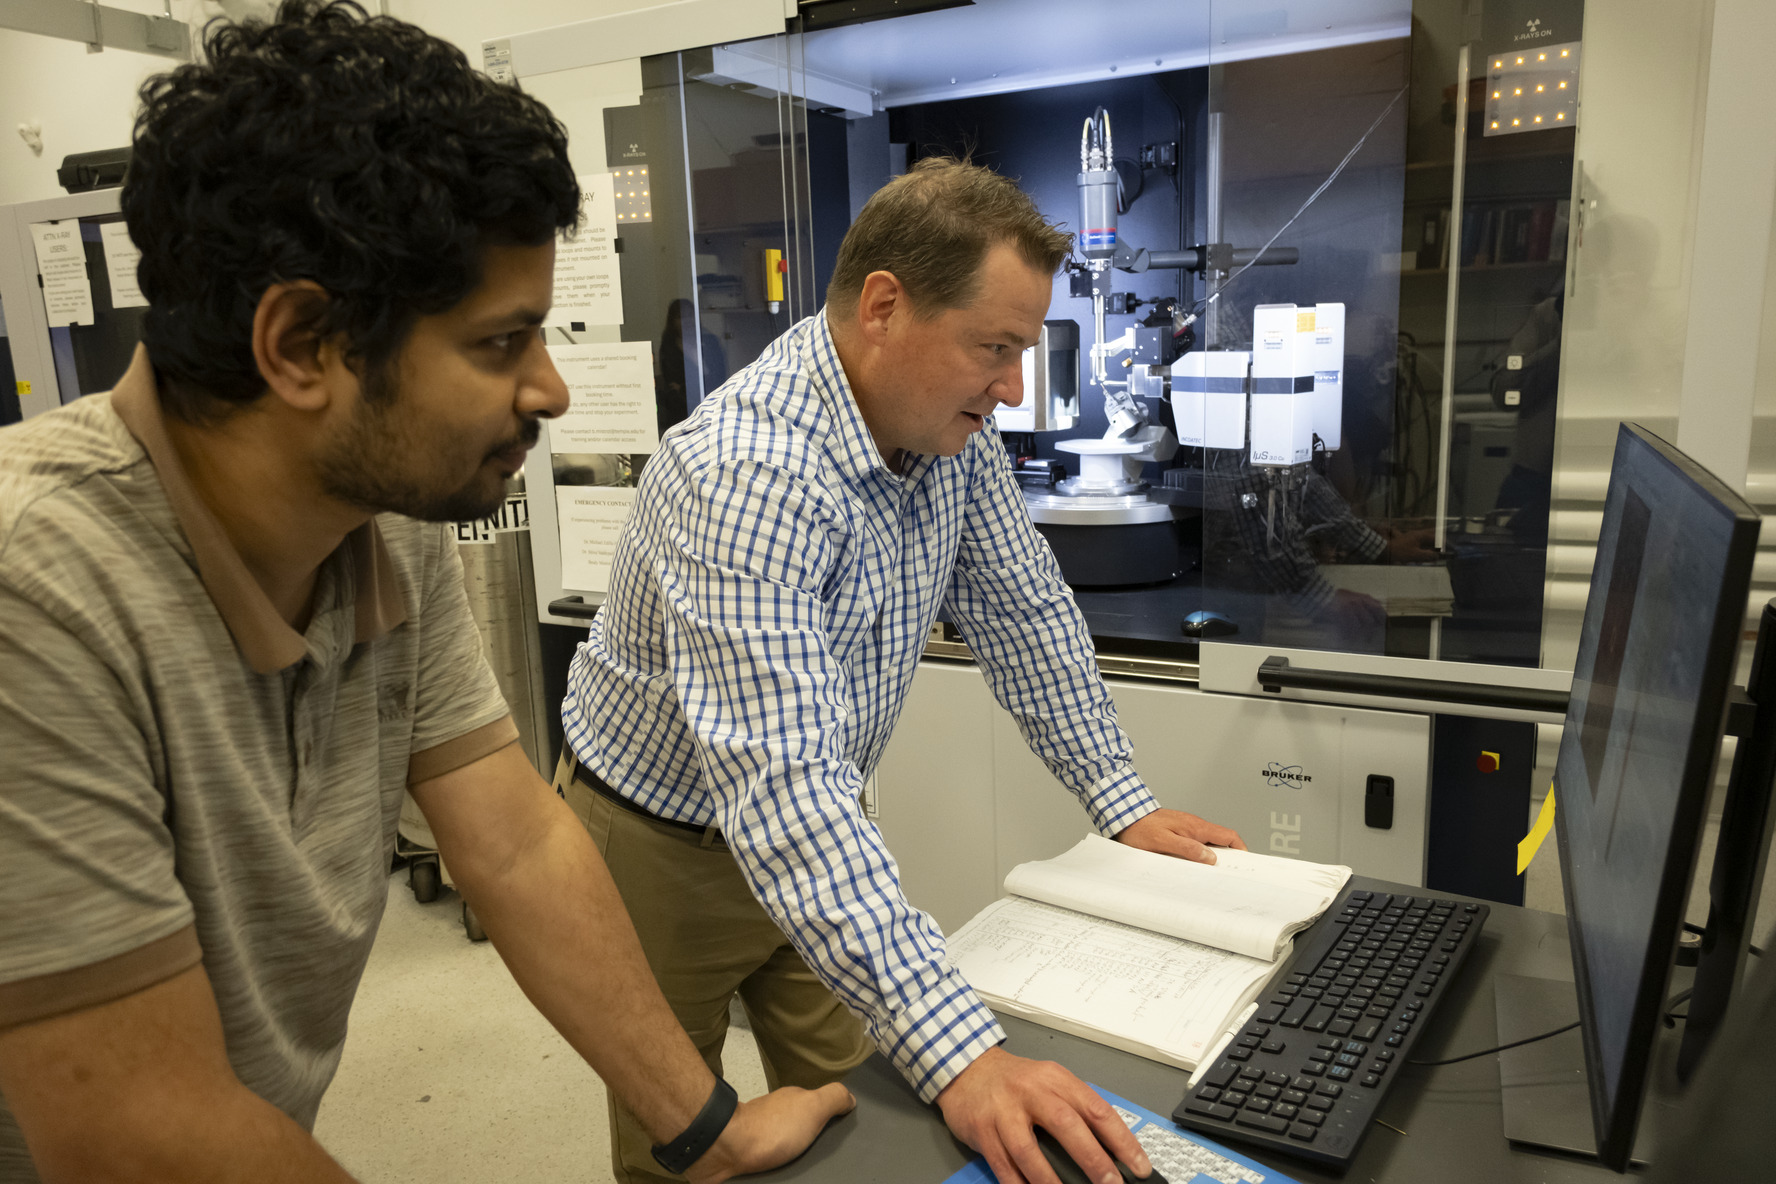
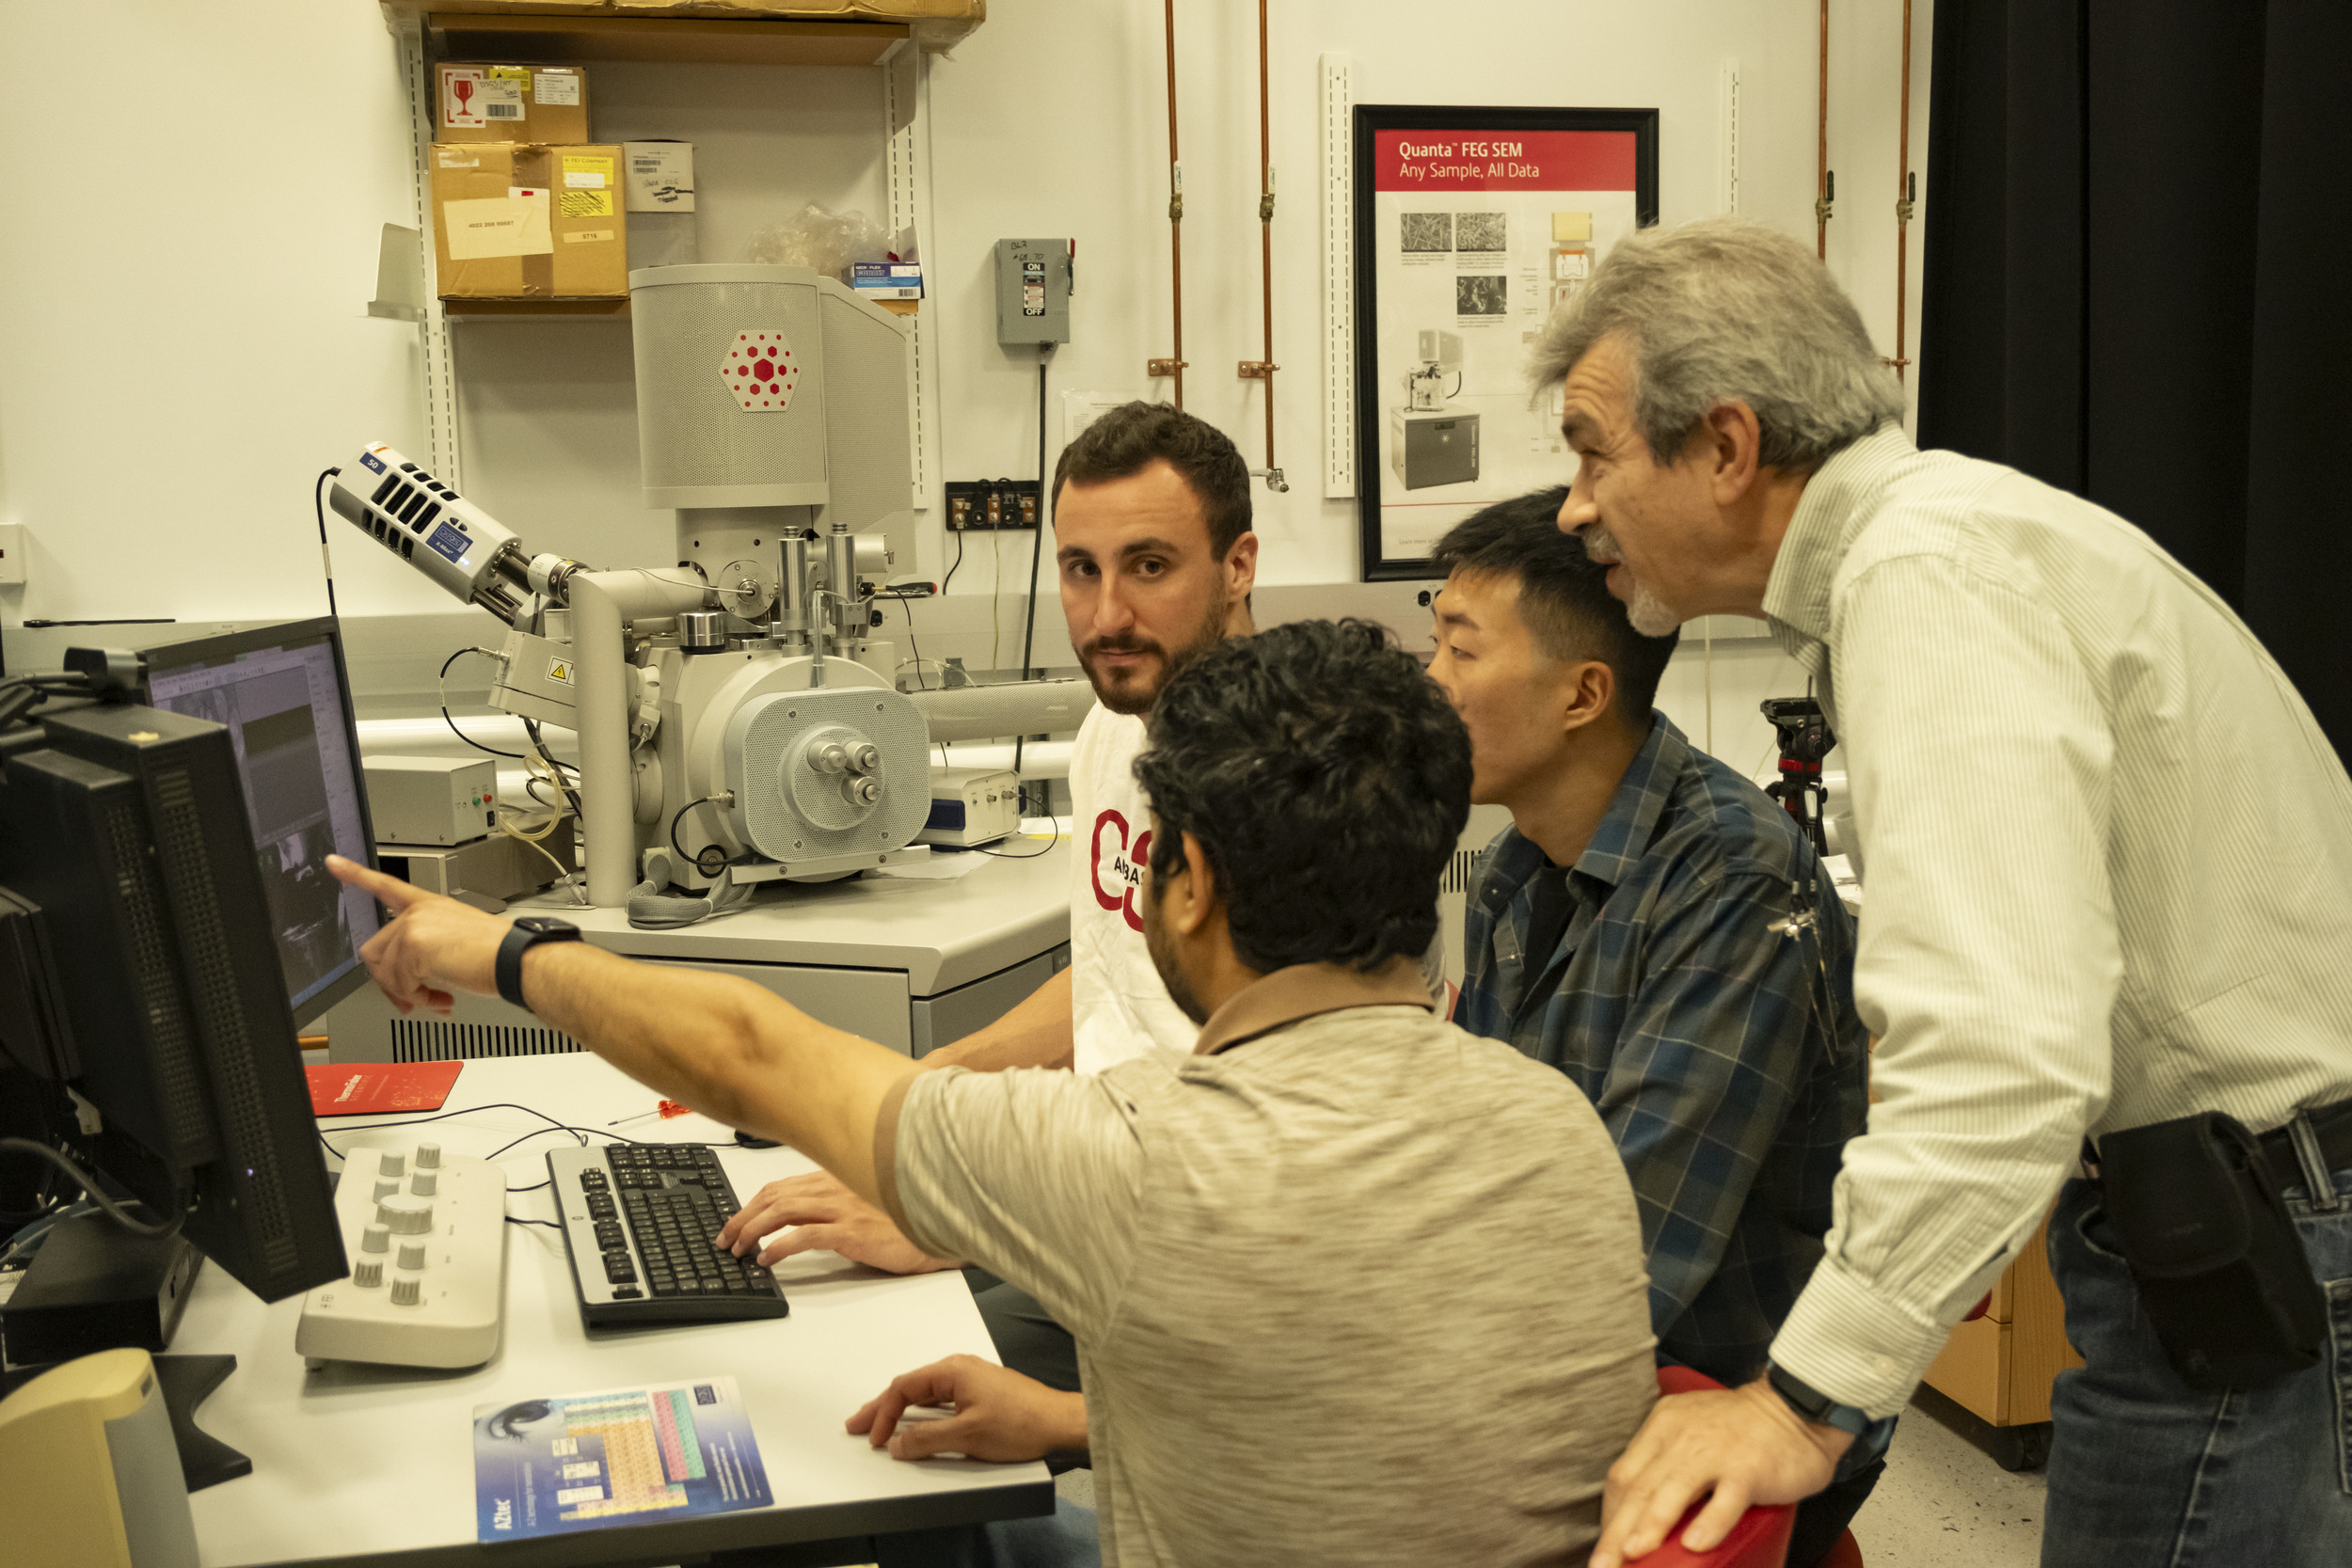
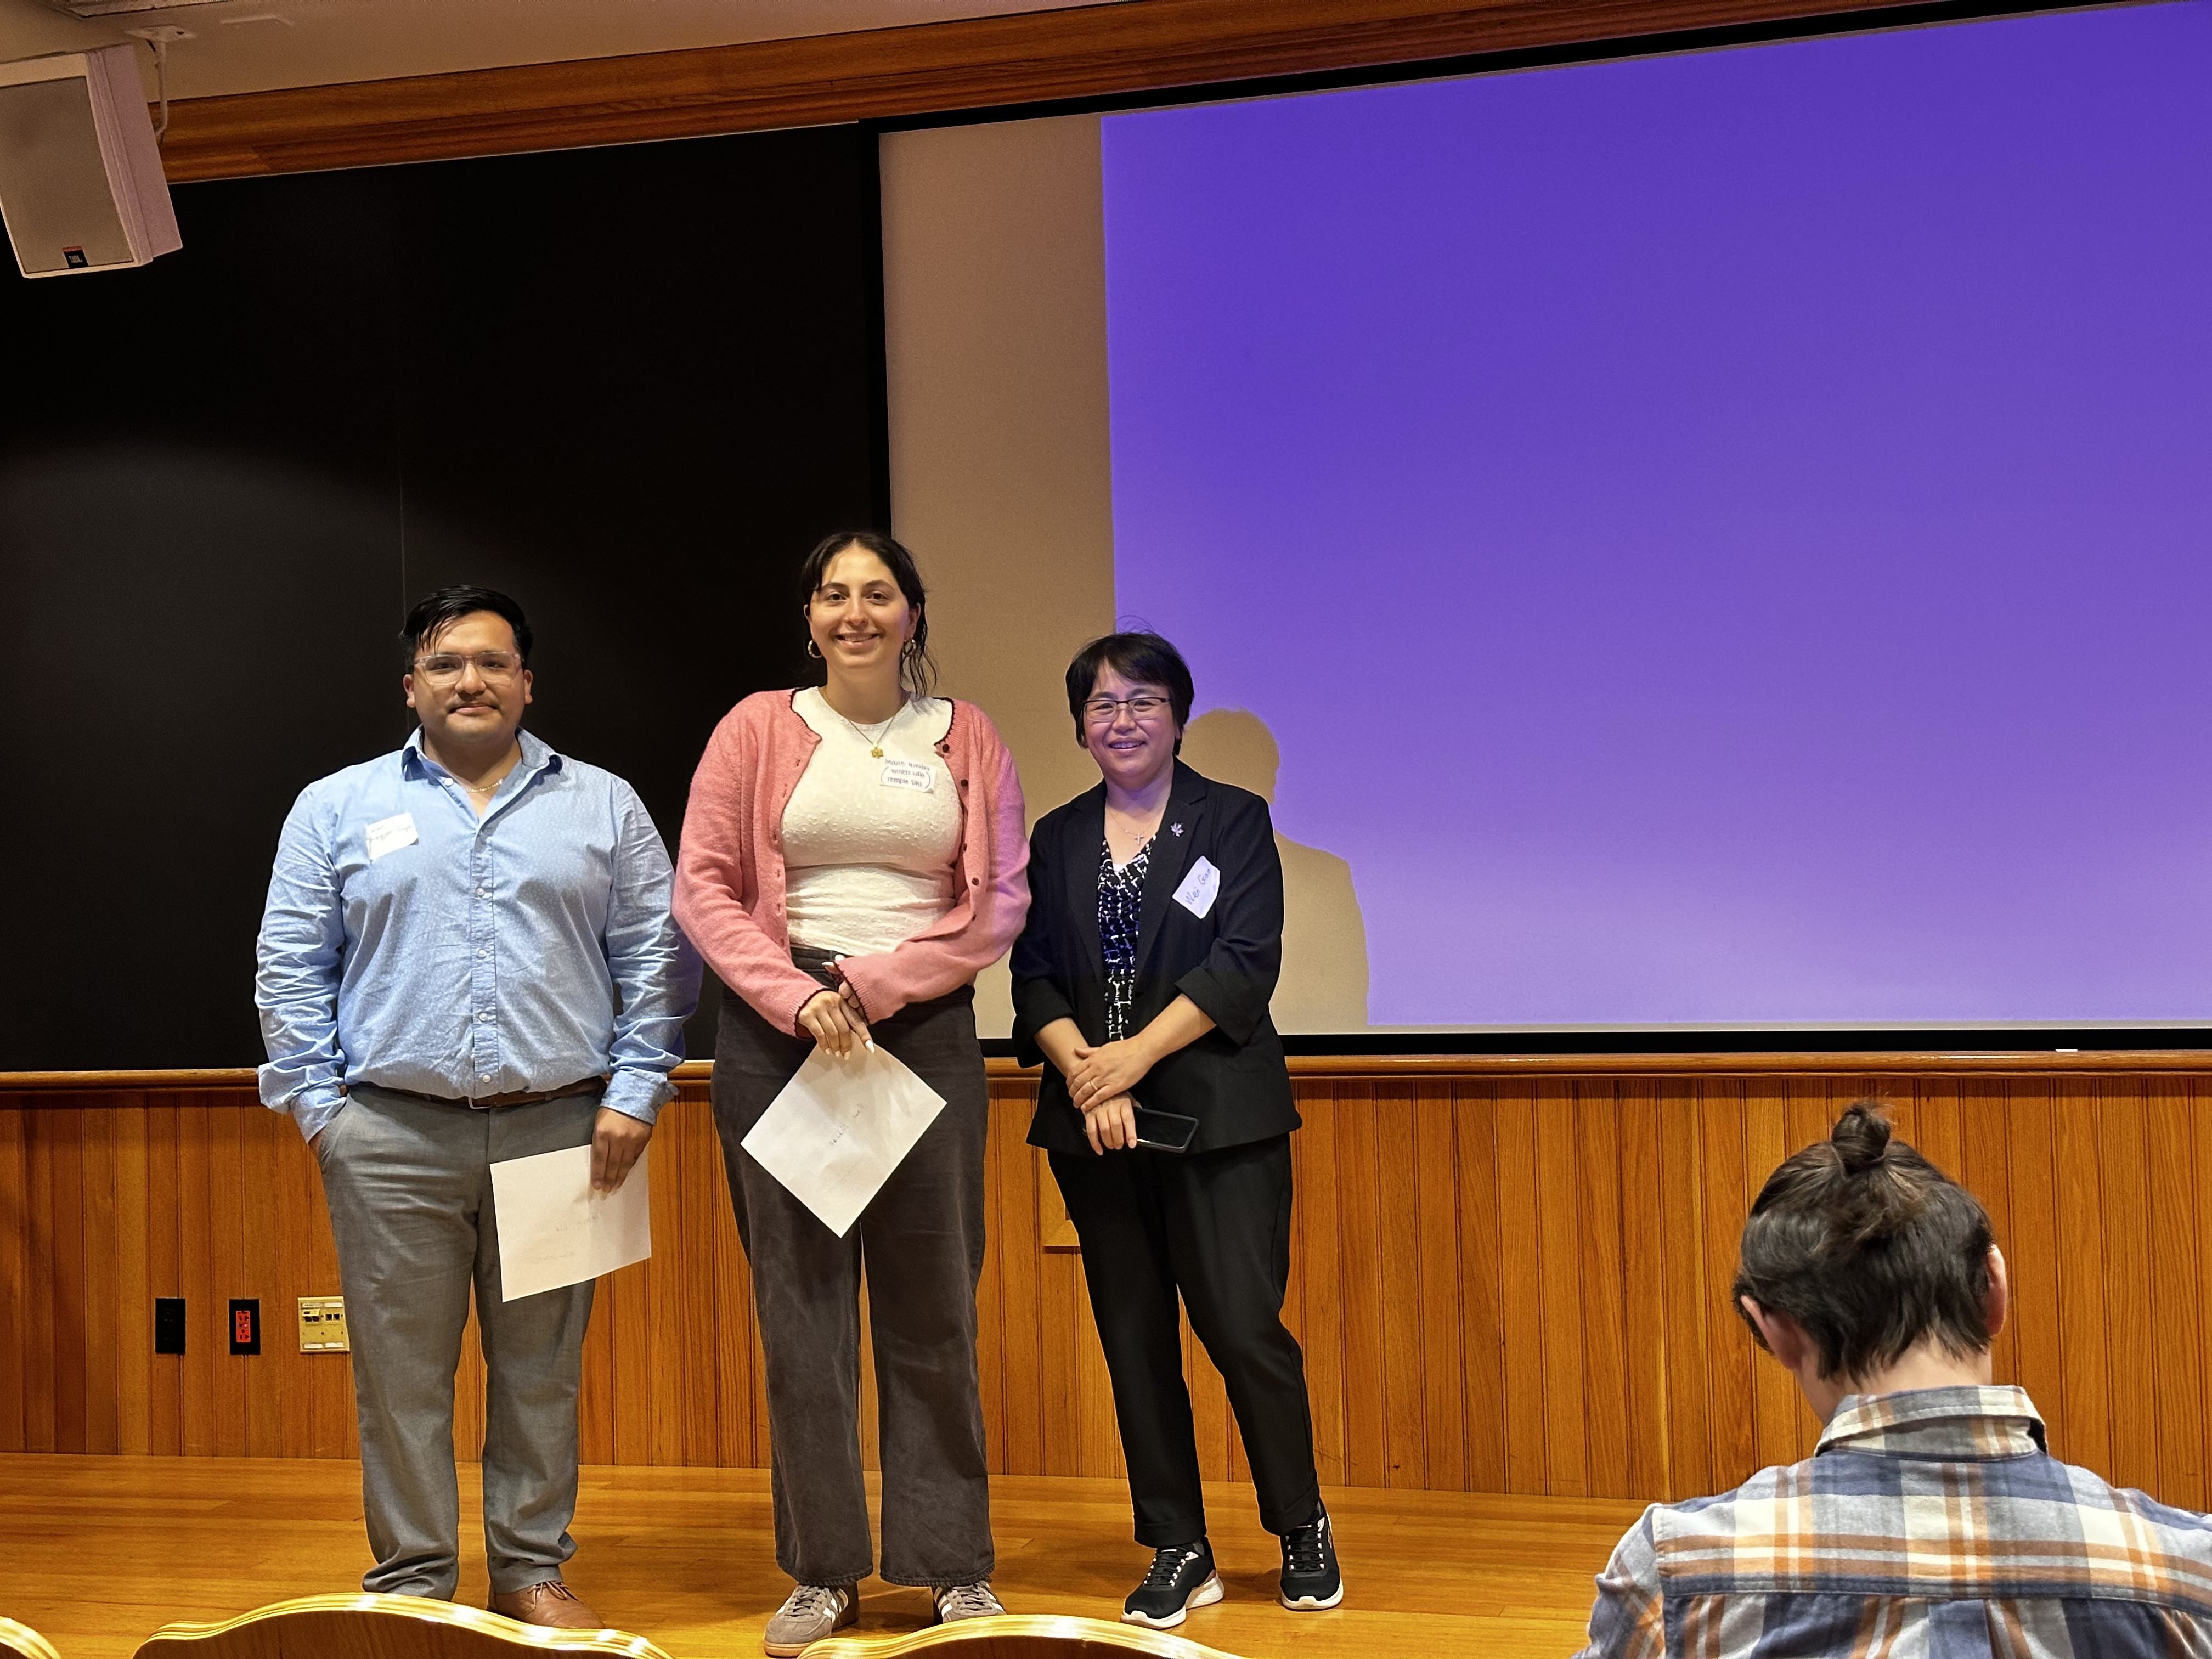
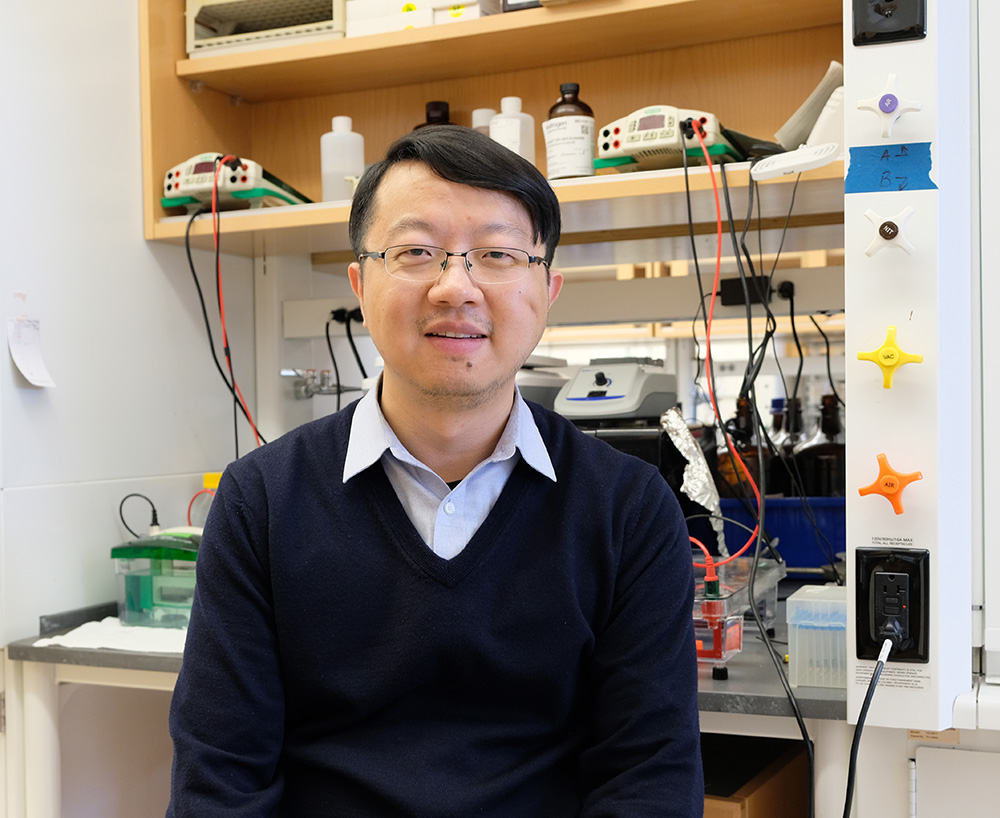
USGS Hydrologic technicians installing a streamgage in Chester County, PA, that will help monitor flood conditions.Photo by USGS Pennsylvania Water Science Center Jan. 5, 2026 Temple University Ambler and USGS Begin New Partnership on Campus By James DuffySince its inception more than a century ago as the Pennsylvania School of Horticulture for Women […] Dec. 5, 2025 Dean Mostafá recognized for scientific impact by historic medical school in Italy By Greg ForniaMiguel Mostafá, dean of Temple University’s College of Science and Technology and a professor of […] Nov. 12, 2025 Farid Salazar joins physics department By Greg ForniaA fellow of the RIKEN Brookhaven Research Center, Farid Salazar has joined the department as an […] Nov. 12, 2025 Physics department now offers medical dosimetry PSM degree By Greg ForniaCST now offers a Professional Science Master’s in medical dosimetry. Led by Mulualem Kefene, […] Nov. 11, 2025 Remembering a pioneer: My journey with James D. Watson By Antonio GiordanoIt was an honor and a privilege to have known and worked with James D. Watson, the father of modern […] Five Temple University first-generation students that are leading the way for the next generation of Owls.Photo by Ryan S. Brandenberg Nov. 4, 2025 Meet five first-generation Owls turning opportunity into impact For many Temple University students, being the first in their family to attend college is more than […] Photo by Connor McVail Oct. 28, 2025 Get to know: Biology’s Yu-Chieh David Chen By Greg ForniaYu-Chieh David Chen, a new assistant professor in the Department of Biology, earned his PhD in […] Oct. 21, 2025 NSF awards $1.5 million to advance Temple-built software for genomic analysis By Sarah ChungThe National Science Foundation has awarded Temple University a $1.5 million grant to develop new […] Photo by Joseph V. Labolito Oct. 16, 2025 New cutting-edge microscope will advance region’s medical and energy research By Jonny HartA new award from the National Science Foundation will support a state-of-the-art three-beam […] Dmitriy Dikin directs the Nano Instrumentation Center, where he supports research involving Temple's scanning electron microscopes.Photo by Joseph V. Labolito Oct. 15, 2025 Temple’s new cutting-edge microscope will advance region’s medical and energy research Scanning electron microscopes (SEM), and their ability to help researchers visualize matter at the […] Marie Nikolov (center) at the ACS YCC meeting. Oct. 15, 2025 Marie Nikolov from Willets Lab wins poster prize at ACS Younger Chemists' Committee By V WilentMarie Nikolov from the Willets Lab won a poster prize at the American Chemical Society Younger […] Oct. 13, 2025 Developing molecular toolkits to better understand and treat disease By Elisa LudwigWith significant new federal funding, the College of Science and Technology is advancing […] Sep. 26, 2025 Jessica Babcock selected as CAT Faculty Fellow By MathematicsProfessor Jessica Babcock has been selected as one of the Center for Advancement of Teaching’s […] Photo by Michele Benzi Sep. 26, 2025 Daniel Szyld’s work featured in SIAM news By MathematicsProfessor Daniel Szyld’s research and career have been highlighted in the Society of Industrial and […] Sep. 26, 2025 Sam Taylor named a 2025 Simons Fellow in Mathematics. By MathematicsCongratulations to Professor Sam Taylor on receiving a 2025 Simons Fellowship in Mathematics. The […] Load More
USGS Hydrologic technicians installing a streamgage in Chester County, PA, that will help monitor flood conditions.Photo by USGS Pennsylvania Water Science Center Jan. 5, 2026 Temple University Ambler and USGS Begin New Partnership on Campus By James DuffySince its inception more than a century ago as the Pennsylvania School of Horticulture for Women […] Dec. 5, 2025 Dean Mostafá recognized for scientific impact by historic medical school in Italy By Greg ForniaMiguel Mostafá, dean of Temple University’s College of Science and Technology and a professor of […] Nov. 12, 2025 Farid Salazar joins physics department By Greg ForniaA fellow of the RIKEN Brookhaven Research Center, Farid Salazar has joined the department as an […] Nov. 12, 2025 Physics department now offers medical dosimetry PSM degree By Greg ForniaCST now offers a Professional Science Master’s in medical dosimetry. Led by Mulualem Kefene, […] Nov. 11, 2025 Remembering a pioneer: My journey with James D. Watson By Antonio GiordanoIt was an honor and a privilege to have known and worked with James D. Watson, the father of modern […] Five Temple University first-generation students that are leading the way for the next generation of Owls.Photo by Ryan S. Brandenberg Nov. 4, 2025 Meet five first-generation Owls turning opportunity into impact For many Temple University students, being the first in their family to attend college is more than […] Photo by Connor McVail Oct. 28, 2025 Get to know: Biology’s Yu-Chieh David Chen By Greg ForniaYu-Chieh David Chen, a new assistant professor in the Department of Biology, earned his PhD in […] Oct. 21, 2025 NSF awards $1.5 million to advance Temple-built software for genomic analysis By Sarah ChungThe National Science Foundation has awarded Temple University a $1.5 million grant to develop new […] Photo by Joseph V. Labolito Oct. 16, 2025 New cutting-edge microscope will advance region’s medical and energy research By Jonny HartA new award from the National Science Foundation will support a state-of-the-art three-beam […] Dmitriy Dikin directs the Nano Instrumentation Center, where he supports research involving Temple's scanning electron microscopes.Photo by Joseph V. Labolito Oct. 15, 2025 Temple’s new cutting-edge microscope will advance region’s medical and energy research Scanning electron microscopes (SEM), and their ability to help researchers visualize matter at the […] Marie Nikolov (center) at the ACS YCC meeting. Oct. 15, 2025 Marie Nikolov from Willets Lab wins poster prize at ACS Younger Chemists' Committee By V WilentMarie Nikolov from the Willets Lab won a poster prize at the American Chemical Society Younger […] Oct. 13, 2025 Developing molecular toolkits to better understand and treat disease By Elisa LudwigWith significant new federal funding, the College of Science and Technology is advancing […] Sep. 26, 2025 Jessica Babcock selected as CAT Faculty Fellow By MathematicsProfessor Jessica Babcock has been selected as one of the Center for Advancement of Teaching’s […] Photo by Michele Benzi Sep. 26, 2025 Daniel Szyld’s work featured in SIAM news By MathematicsProfessor Daniel Szyld’s research and career have been highlighted in the Society of Industrial and […] Sep. 26, 2025 Sam Taylor named a 2025 Simons Fellow in Mathematics. By MathematicsCongratulations to Professor Sam Taylor on receiving a 2025 Simons Fellowship in Mathematics. The […]